Almost every store gets its checkout count from habit. Someone counts the lanes in a comparable store, someone else adds one because the queue looked long last December, and the order goes out. That works until the format changes, the peak moves, or a rollout multiplies the mistake across forty locations.
Terminal count is a capacity calculation, and it runs off four inputs you can actually measure: peak-hour transactions, service time per transaction, a target utilization, and the number of separate service points. Everything else — drawer count, spares, counter length — follows from those.
The short answer
Divide peak-hour transactions times service seconds by 3600 times your target utilization, then round up:
Lanes = peak-hour transactions × service seconds ÷ (3600 × 0.70)
Use 0.70 for a store where a visible queue costs you baskets, and 0.80 only where customers expect to wait. Then apply three corrections: add one lane for every separate service point (returns, click and collect, age-restricted sales), buy one drawer per concurrent cashier rather than one per lane, and carry one spare terminal per site or per ten lanes, whichever is greater.
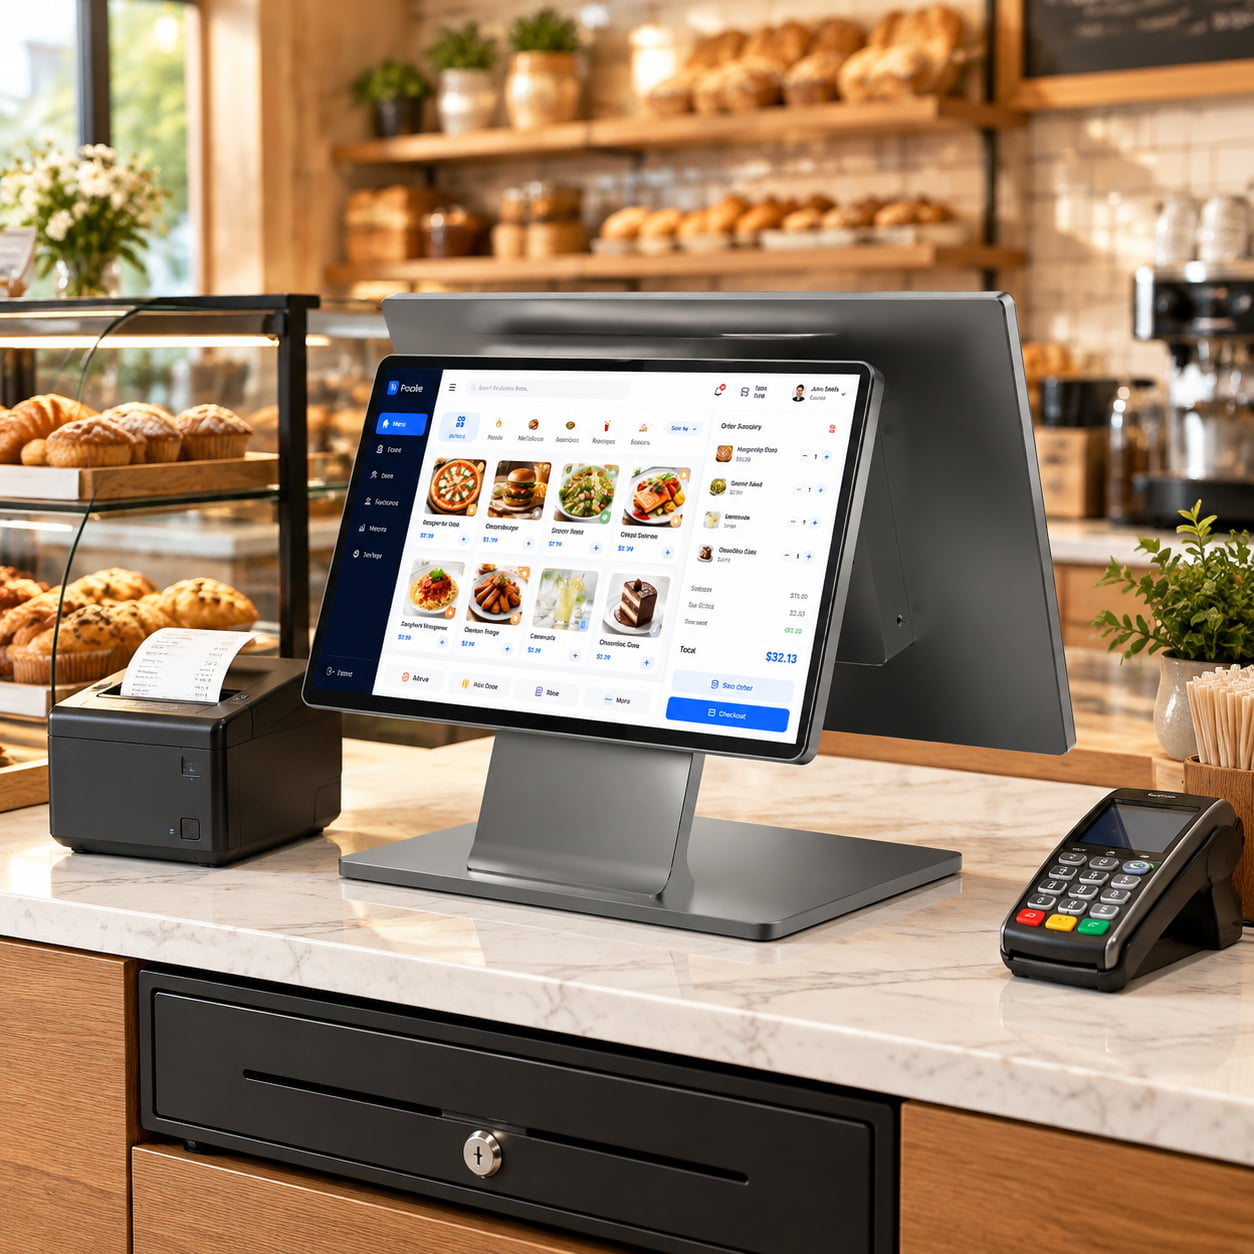
For a typical urban convenience store that lands on two terminals. A mid-size supermarket lands on fifteen to eighteen. A busy quick-service counter lands on four or five staffed lanes. The rest of this page shows the arithmetic, because the number is only defensible if the buyer can reproduce it. What the lane then has to do at that volume is a separate question, and what a c-store lane actually looks like at peak takes it from the counter rather than the terminal.
Daily volume is the wrong input
A store doing 1,200 transactions over a twelve-hour day averages 100 an hour. It does not serve 100 an hour. On a Saturday it may serve 45 an hour at 09:00 and 190 an hour at 11:30. Size to the average and the store spends its busiest two hours every week with the queue out the door, and its quietest six hours with a terminal nobody uses.
Peak-hour share of daily volume varies by format, and you should measure your own rather than adopt these, but the planning bands look like this:
| Format | Peak hour as share of daily transactions | Shape of the peak |
|---|---|---|
| Convenience store | 11–15% | Two sharp windows — morning coffee and evening top-up |
| Supermarket / grocery | 12–18% | One broad Saturday or Sunday block |
| Quick-service restaurant | 25–35% | One very sharp lunch window, 60–90 minutes |
| Pharmacy | 14–20% | Flat with a prescription-collection spike |
| Specialty / electronics | 18–25% | Weekend blocks, low transaction rate, long service time |
Quick-service is the format where averages mislead most badly. A restaurant doing 700 orders a day may put 190 of them through in one hour, which is 27% of the day in 4% of the trading hours.
The four inputs, and how to get each one
| Input | Symbol | Where it comes from | Common error |
|---|---|---|---|
| Peak-hour transactions | T | Hourly report from the existing POS, or a two-week manual tally | Using the daily average, or a peak that excludes the pre-holiday week |
| Service time per transaction | S | Stopwatch, 100 samples across two peak hours, arrival to receipt handed over | Timing only the scanning and ignoring payment authorization |
| Target utilization | U | Policy decision, not a measurement | Assuming 1.0, which is physically impossible |
| Separate service points | P | Floor plan and store process | Assuming returns run on a checkout lane without adding time to it |
The formula gives you lanes for throughput. Service points are added on top, because a returns desk open for eight hours consumes a device and a screen whether or not anyone is queuing at it.
Service time is the variable people guess wrong
Service time means the whole interaction: greeting, scanning, bagging, payment authorization, receipt, and the customer putting their card away. Measured that way it is consistently longer than the number a store manager gives off the top of their head, because the payment leg has grown.
| Transaction type | Planning range for service time | What dominates it |
|---|---|---|
| Convenience, 1–5 items, contactless | 30–45 s | Payment tap and receipt choice |
| Pharmacy or drug store, 5–12 items | 45–65 s | Item lookup and age or prescription checks |
| Supermarket, 20–40 items | 65–90 s | Scanning and bagging, not payment |
| Quick-service counter order | 55–75 s | Order entry, modifiers, then payment |
| Specialty, serialized or warranty-linked | 180–300 s | Product explanation and registration |
These ranges exist to sanity-check your measurement, not to replace it. A store that measures 95 seconds where the band says 65 has found something worth knowing — usually that one staff member handles both the till and the coffee machine.
Two measurement rules that change results. First, time from the customer reaching the counter to the receipt leaving your hand, not from the first scan. Second, sample both a weekday peak and a weekend peak, because the basket mix differs and the weekend one is usually longer.
Why the target is 70%, not 100%
Utilization is not a comfort setting. It is a queue multiplier, and the relationship is not linear. For a single server with random arrivals, the average number of people waiting is U² ÷ (1 − U):
| Utilization | Average customers waiting | What it looks like at the counter |
|---|---|---|
| 50% | 0.5 | Usually nobody, occasionally one |
| 60% | 0.9 | One person most of the time |
| 70% | 1.6 | One or two, clears quickly |
| 80% | 3.2 | A visible line at peak |
| 90% | 8.1 | Line reaches the aisle |
| 95% | 18.1 | Abandonment; customers put the basket down |
A lane at 95% utilization is not 35% busier than a lane at 70%. It carries roughly eleven times the queue. That is the entire argument for buying the next terminal before the queue is visible: the last 10% of capacity is where the customer experience collapses, and it is also the cheapest 10% you will ever buy, because the counter, the network drop and the staff are already there.
The corollary matters for budgeting. If your calculation returns 3.4 lanes, you buy 4, not 3 — and 3 is not a 15% saving, it is a permanent queue at exactly the hour that pays the rent.
Three worked examples
| Input or output | Urban convenience store | Mid-size supermarket | Quick-service restaurant |
|---|---|---|---|
| Daily transactions | 900 | 4,200 | 700 orders |
| Peak-hour transactions (T) | 110 | 600 | 190 |
| Service time (S) | 38 s | 72 s | 65 s |
| T × S | 4,180 | 43,200 | 12,350 |
| ÷ (3600 × 0.70) = 2,520 | 1.66 | 17.14 | 4.90 |
| Staffed lanes | 2 | 18 | 5 |
| At 0.80 utilization instead | 1.45 → 2 | 15.0 → 15 | 4.29 → 5 |
| Plus service points | 0 | +2 (returns, click and collect) | +1 (mobile order pickup) |
| Terminals on the floor | 2 | 20 | 6 |
Read the convenience store row carefully. One terminal cannot serve that store at all: 110 transactions at 38 seconds needs 4,180 seconds of till time inside a 3,600-second hour, which is 116% of one lane. The second terminal is not a comfort purchase, it is the difference between a working store and a queue that never clears.
The supermarket shows the value of the utilization choice. Eighteen lanes at 70% becomes fifteen at 80%, and the question is which one the store can live with on a Saturday. At 15 lanes the peak runs at 80% and the queue sits around three people — acceptable in grocery, where customers expect to wait, and unacceptable in convenience, where they do not.
Self-order kiosks in the restaurant change the shape rather than the total. Two kiosks taking a share of the lunch peak reduce the staffed lanes from five to four, but the device count goes up, not down.
Four drivers the formula does not capture
Throughput gets you a starting number. These four move it, and skipping them is how a store ends up with the right number of the wrong things.
- Payment mix. A cash transaction needs a drawer, a change fund and a count. A card-only lane can be a tablet on a stand. If 40% of your transactions are cash, you cannot run a cashless express lane and expect the queue to balance.
- Service points that are not checkout. Returns, click and collect, lottery and tobacco, prescription collection, gift-card and SIM activation. Each needs a screen, a terminal and a person, and each consumes time that never appears in your peak-hour transaction count.
- Shift structure. Lanes are shared across shifts; drawers usually are not. One drawer per cashier per shift is the norm wherever cash is reconciled at handover.
- Counter geometry. The formula can ask for eight lanes on a counter that fits six. Covered below.
Drawers are bought per cashier-shift, not per terminal
A terminal is a capital item that lasts five years. A drawer is a reconciliation boundary. If two cashiers share a lane across a shift change, either they share a drawer and count it twice, or they swap tills, and swapping tills is only possible if you bought the extra drawers.
The practical rule is: one drawer per concurrent cashier, plus a float. Fourteen lanes staffed by fourteen cashiers need fourteen drawers. Fourteen lanes staffed by ten cashiers across staggered shifts need ten, plus two floats for the change runs.
The drawer also constrains what the terminal has to be. A drawer opens on an RJ-11 kick-out pulse from the terminal or the printer, and once you standardize on a drawer you are committed to having a kick-out port on every device that might drive it. That is a port-count question at specification time, not a software question at installation time.
Our cash drawer range covers flip-top, compact and heavy-duty formats; the high-volume lane guide goes into which format survives which duty cycle.
One spare per site, and the arithmetic behind it
A dead terminal at 14:00 on a Tuesday is an inconvenience. A dead terminal at 11:30 on a Saturday, in a store running at 75% utilization, converts the other five lanes to 90% — which by the queue table above means the line reaches the aisle and some customers leave.
Put numbers on it. Six lanes, 80 baskets an hour on each at peak, average basket of 28 dollars, three-hour Saturday peak. One lane down for the whole peak is 240 baskets that either queue or leave; at 28 dollars that is 6,720 dollars of exposure against a spare terminal that costs a fraction of it. Even at a 50% recovery rate the spare pays for itself the first time it is used within two years.
The spare does not have to be a spare terminal. A store with twenty lanes can hold a pool of two across a district. A store with two lanes should hold one on site, because shipping one in takes days and the peak comes every week.
This is also where a spare-parts allowance beats a promise. Bulk orders from us carry a 2% spare-parts allowance by unit count, shipped with the order rather than after a failure, so the spare is in the back room before it is needed rather than on a plane after it is needed.
Counter length is the constraint nobody models
A checkout lane is not a terminal, it is a run of counter. Terminal, printer, drawer, card reader, bagging area and the space a customer stands in:
| Lane configuration | Counter run per lane | Notes |
|---|---|---|
| Full lane: terminal, printer, drawer, bagging | 1.2–1.5 m | Basket size drives the bagging end |
| Card-only lane, no drawer | 0.8–1.0 m | Works for express and click and collect |
| Belted supermarket lane with bagging well | 2.4–3.0 m | Belt length is set by the format, not the hardware |
| Self-order kiosk, standing | 0.6–0.8 m | Plus queue space in front, which is the real cost |
When the formula asks for eight lanes and the counter fits six, you have four options and only one of them is buying more hardware: cut service time, move part of the peak to kiosks, break the counter into a second run, or accept a longer queue at peak. Deciding which one is a store design decision, and it is much cheaper to make it before the counter is built than after.
What the hardware mix looks like at each count
| Lanes | Terminal | Printer | Drawer | Scanning | Add |
|---|---|---|---|---|---|
| 1–2 | All-in-one with integrated printer, or a tablet on a stand | 58 mm if receipts are short, 80 mm otherwise | One per cashier | Handheld, 1D is enough for grocery | Nothing extra; the terminal is the whole system |
| 3–6 | All-in-one, uniform model across lanes | 80 mm with auto cutter | One per lane plus one float | Handheld 2D, one per two lanes | Customer display where queue visibility matters |
| 7–15 | Split: all-in-one on staffed lanes, compact box on express | 80 mm, spares on site | One per cashier-shift | Fixed in-counter scanner on high-volume lanes | Returns or service desk terminal, KDS if food is prepared |
| 16+ | Standardized all-in-one plus a dedicated service-desk model | 80 mm high-speed | Pooled, with a reconciliation station | Fixed scanner plus handheld for shelf work | District spare pool, staged configuration |
Two rules make that table work in practice. Standardize one terminal model per role rather than per store, because a mixed estate multiplies spare parts, training and configuration drift. And put the highest-throughput peripheral where the highest-throughput lane is — a fixed in-counter scanner on the express lane is worth more than a second handheld.
The relevant starting points are the all-in-one terminal range and the POS terminal category, with receipt printers, cash drawers and barcode scanners alongside them.
Sizing a rollout rather than a store
Once the per-store number is settled, the rollout question is how many distinct configurations you are willing to support. Three is a workable maximum: a full lane, a compact lane, and a service desk. Every additional configuration adds a spare-parts line, a software image and a training document, and those costs persist for the life of the estate while the per-unit saving that justified the variation does not.
Build the order from a per-store bill of materials rather than a total, because the two failure modes are different. Under-ordering leaves a store with lanes it cannot staff; over-ordering leaves boxes in a stockroom that nobody reconciles until the next audit.
Our minimum order is one unit, so a pilot of two or three stores is a normal order rather than a negotiation, and OEM configuration starts at 50 units. We ship standard orders in 10 to 15 days, which matters when the pilot result arrives and the decision window is short.
The phased sequencing, store categorization and installation logistics are on the multi-store rollout guide; this page stops at the number.
Five sizing mistakes worth avoiding
- Sizing to the daily average. It produces a store that is over-equipped eleven hours a day and under-equipped for the two that matter.
- Timing only the scanning. Payment authorization and receipt handling are a third to a half of service time in most formats, and they are the part that grew.
- Planning to 100% utilization. Above 80% the queue stops responding to small changes and starts responding to variance. There is no version of 100% that works.
- Buying drawers per terminal. The count that matters is concurrent cashiers, and it is almost always different.
- Forgetting returns and click and collect. They run all day on a device that never appears in the transaction count.
How to validate the number before you commit
Two weeks of measurement is enough, and it is cheaper than being wrong for five years.
Pull hourly transaction counts from the existing system, or tally by hand if there is nothing to pull from. Time 100 transactions across two peak hours, split by weekday and weekend. Run the formula. Then compare the result against the queue you actually see: if the formula returns four lanes and the store visibly queues with four, the service time is longer than you measured, and the answer is to fix the measurement rather than to add the lane.
For a multi-store rollout, prove it on two or three stores before the order scales. That is the point at which a sizing error is still a correction rather than a program.
Frequently asked questions
How many POS terminals does a small retail store need?
Most small formats need two: one primary lane and one for the peak. A single terminal carries about 66 transactions an hour at a 38-second service time and 70% utilization, with an absolute ceiling near 95 an hour before the queue grows without limit, so any store whose peak hour exceeds that needs a second device regardless of how small the shop is.
Is one POS terminal per store ever enough?
Only where the peak hour stays under roughly 65 transactions and the store can tolerate a queue when the terminal fails. A single-lane store has no redundancy at all, so the practical answer is one working terminal and one spare on site rather than one terminal.
Should I count cashiers or lanes when ordering terminals?
Count lanes for terminals and cashiers for drawers. A lane is a physical position with a screen, a printer and a network drop; a drawer is a reconciliation boundary tied to whoever is accountable for the cash in it. The two numbers differ whenever shifts overlap.
How much does a checkout queue cost in lost sales?
It is calculable rather than theoretical. Take the baskets that abandon the queue, multiply by average basket value, and compare against the cost of the additional lane. A planning assumption of one abandoned basket in five at high utilization is common in retail capacity planning, and it is worth replacing with your own count from a week of observation.
Do self-checkout or kiosks reduce the number of staffed lanes?
They reduce staffed lanes, not device count. Kiosks absorb part of the peak and shift the constraint from counter staff to floor staff who resolve problems, so plan them as an addition to the lane count rather than a replacement for it.
How many spare terminals should a multi-store estate hold?
One per site for stores with six lanes or fewer, and a pooled spare per ten lanes above that. Bulk orders also carry a 2% spare-parts allowance by unit count, shipped with the order, which covers the common failure points without needing a full spare unit at every location.